Business Intelligence for Learning About Students
Case study written October 2012.
Contents
Background
Business Case
The principal aim of the project was to allow the relevant stakeholder to build a better picture of student admission and academic progression within the University of Sheffield. The key aim of the project is to enable any end user to connect together information about students and admissions data with external data sources. Our external data sources come from HESA or Data.gov.uk initially but in principle our application will allow end users to understand how any external data source can be placed in the context of student admissions (or student data in general).
Aims and Objectives
Aims
- To create a tool and a methodology that allows users to integrate internal data stored about students with external information in order to assist different sets of users in interpreting that data.
- To assess the impact that this tool has on BI within the University and what the corresponding impact on the policies and procedures used in the University after it has been in use by a wide group of users.
Objectives
- To identify a methodology for connecting together internal data sources which contain knowledge relating to students. To use this methodology to derive a single knowledge store which contains all the relevant information extracted from internal data sources.
- To extend our methodology in order to allow the linking of internal to external data sources. To define ways of allowing stakeholders to connect this external data to the internal data store as required and to enable an analysis of the effect that this has on student admissions and progression within the University.
- To assess the impact that the improved BI generated in the prior objectives has on the policies and procedures present within the University – i.e. can we identify a link between the new interpretations that advanced visualizations enable.
Context
There is an increasing drive to make data that has been generated through the actions of public money openly available to the public. This drive has been centered around a number of open data silos being created which act as centralised hubs for open data. The intention behind this opening up of data is that it allows organisations and companies can leverage the data to provide tools and services which were previously out of their reach. It also allows organisations to connect their internal data sources to these open data sources in order to generate new insights into their resources.
Whilst this is the intended outcome for open data there is an additional requirement for study of the use of open data sources. Whilst there have been some notable tools developed which make use of open data sources the case for making signifficant efforts to make data available to the public is not yet clear. This project will investigate how open data can be leveraged against Sheffield student data in order to derive insights into student origins.
The key drivers for this project are twofold. The changing nature of student admissions and higher education in general means that the admissions process must become more responsive. In addition, the process of widening participation means that the admissions process must also be more accountable, requiring new insights and new methods for demonstrating that the measures put in place in order to widen participation are effective. The use of open data also means that admissions bodies have a new means of measuring and justifying admissions process.
Our approach within the project is inherently technology centric. Thus we have developed a tool to demonstrate the use of open data in the context of student data. We have released this tool to users in order to gauge their response to the tool and to develop an understanding of how open data sources can be used in this domain. Typically in developing new forms of software two approaches can be taken - one can build an understanding of current practices in order to drive new technology or one can develop new techniques and assess how this functions for a given task. In addition we are following a user centered design process - one which involves users in order to drive technological development.
The scope of our work is principally centered on admissions. However, whilst this domain will be used to derive and drive the development of the tool, our work will be applicable to other areas. In addition, the key aim of the project is to assess the potential impact of open data and so our tool will sufficiently act as an enabler.
- Technologies and Standards
Our application is largely self developed. Some external libraries are used for plotting maps and drawing graphs, these libraries are all open source and freely available. The data import process has been developed in house and leverages the consistency in formatting of typical open data sources. A outcome of the project has been the open sourcing of the importer system (see Chapter 5.1).
- Establishing and Maintaining Senior Management Buy In
Our project is focused on determining how open data can be enabled and leveraged to enhance understanding. We expected that management buy in would be dependent on the success of open data sources to achieve these aims. We have trialed our software with a relatively small number of end users as we explore the space and understand the needs and requirements of our users.
Outcomes
JISC BI Maturity Levels
Whilst BI tools bring value to stakeholders within the University there is often the catch 22 problem that the data needed to justify the development of the BI tool is the data that would be generated by the BI tool. One approach to finessing this problem is to leverage the data that is available internally and combine it together with data that is freely available externally in order to build a rich analysis dataset. Whilst the data to support this type of analysis exist, they are not necessarily stored in a single location or easily connected together. In addition it can be difficult to manipulate or to bring the relevant information together in suitable visualizations. For example, key information about student well-being may be stored by individual departments but not centrally, or the University may record the postcode of each student admission or application but an extra step is then required to be able to examine this information in more detail or connect it with socioeconomic data from elsewhere. An informal analysis of the state of BI within the university suggests that despite some fragmentation of information, the University is currently operating at level 5 on the JISC BI Maturity Model.
Data Visualizations
We present two data visualizations:
Notable Offenses
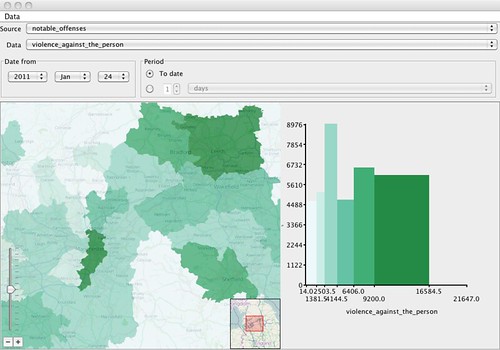
This figure shows a detailed view of our overall viewing system. The user is able to select a source - which is essentially a generic collection of data. Our research into open data source structure indicated that it was common for data to be organised into multiple worksheets within a Excel file. Thus our system allows user to import a single excel file and then access the individual worksheets in more detail.

Figure 1: Connecting student numbers with statistics about Violence
The data field allows the user to select the specific column that they would like to examine. Typically the data files would contain a large number of data columns, some being characteristic columns and some being informational columns. Our system automatically identifies the characteristic columns by looking for common patterns. So data fields like postcodes, output areas, counties etc. are automatically identified and used to control the nature of the data display.
The user is then able to select the period of time in which students should be considered. So this will allow users to define which cohort of students is being analysed at a given time. The image shows a previous version of the application where the date range could be open-endedly specified. Although there are some cases where admissions are made over a period of time, it is more common for our user to consider students in groups of a cohort and so the new interface reflects this change.
Below the data specification sections are the two displays. On the left there is a map of the country (and the world), over which the chosen data is overlaid. The map display here shows the relevant elements of data contained within the selected file - the boundaries being determined by the granularity of information in the dataset chosen. On the right is a bar graph which gives a read out of the mashed up data for the given map.
So here we can see that the darker areas on the map are reflective of an increase in the level of “violence against the person” and that in the bar graph we can see that the majority of the students are taken from areas with a low level of “violence against the person”.
Employment
The second visualization we present shows a much larger part of the country. Here we have selected the deprivation data set which allows us to see a number of indicies which reflect levels of deprivation across the country. Again, the visualisation shows areas from which students have originated and the bar graph shows the number of students in each of the categories represented on the map.

Figure 2: Connecting student numbers with statistics about employment
The key property of the application is the interaction - moving the map, or zooming in or out causes the graph to be updated. This enables the user to perform data exploration - that they can move around the map and immediately see the updates on graph. Thus the user can explore the graph in the context of the map, as they wish.
So if the user wants to compare the north of England with the south of England, they can navigate to those two regions and perform that comparison.
Achievements
The key achievements of this project have been the reasonably rapid development of a useful demonstrator tool. We have produced a tool that achieves three principle goals: 1) It is able to import any open data source that meets some minor structural requirements, 2) it can connect geographic data to our local student admissions data and 3) it is able to produce a quick interactive visualisations. This has been made possible through having a competent programmer work on the project, alongside the consultant company’s expertise. With the framework that this project has developed there is potential to build upon the codebase and create more advanced visualisations.
The feedback from the user group (see Section 3.3 demonstrates that the tool has validity and, whilst it may not meet the specific needs of all users, the approach taken has potential to support the use of open data within Higher Education Organisations.
Benefits
The benefits of the project are not immediately apparent as it has raised as many questions as it has answered, and consequently impact will be best evaluated over the long term. The real benefit of our project is in demonstrating the value of integrating open data sources with our local student databases. Whilst it is difficult to locate data, the speed of analysis and ease of use of the tool was beneficial. We see this tool as a prototype which demonstrates the ease by which more tools can be developed - thus the tool can be used as an example of the potential value in taking data and transforming it into some interactive and informational.
Key lessons learned
Our project covers two distinct fields: The use of open data sources, and the benefits to be made by linking internal student data to external data sources.
Open Data Sources
We principally examined the data.gov.uk website in our initial analysis - we present our findings below.
The data.gov.uk website was officially opened in September 2009. As of 2012 it contains around 7,000 datasets from a range of government sources. It’s principal aim is to increase transparency between publically funded work that is carried out by the government and to ensure that citizens that fund data collection ultimately have access to the data that has been created from their taxes. Datasets come from a broad range of sources and the site allows users to comment and discuss the data sets and their origins and use. Furthermore the site collects examples of applications which make use of the data sets. In addition to the static data sources there are also linked data sources.
Type of data available
The type of data available is extremely broad. At one end of the spectrum there is a dataset containing each spend above £25,000 made by the cabinet office, at the other spectrum there is a dataset listing the number of shopping trolleys that have been abandoned in Bristol rivers. Though the majority of data originates from the departments of health, transport and local government. The broad nature of the data leads to the principle problem of the site - it is difficult to use it to locate useful data sources within the site, unless you have very specific needs. Even though you can search by keywords and browse by data origin, the amount of data in each category means that the search time can be quite high.

Figure 3: Example of data.gov.uk web page
Granularity of data
Information about the overall granularity is difficult to ascertain. Each dataset is supplied with additional, machine readable metadata which lists properties of the dataset, including its geographic granularity. The use of this metadata is mixed with half of the datasets describing their geographical spread within the metadata - the majority (2,000 datasets) being described at the country-wide level. Fewer datasets are at the level of local authority and a smaller number still are described as being at the level of super output area. Given this analysis we conclude that the datasets on the site are largely broad data rather than specific. This makes the data less useful as we cannot account for the variation in the various data that exists.
Data Use
To measure the data use we counted the number of comments applied to each page. This is a crude measure since there is no requirement for users to comment on datasets but it does provide an indication of which datasets are heavily used and which are not. Out of the 7,000 datasets listed 185 (around 3%) have comments attached - overall there are around 450 comments applied to the datasets. The most commented dataset is COINS - a set describing a wide range of government expenditure; a brief scan through the comments seem to suggest that the majority of them are concerned with making sense of it rather than making use of it. Beyond coins the other datasets which receive a large number of comments are the two transport datasets: NAPTAN and NPTDR - these contain information about bus and train timetables across the UK. From this lightweight analysis we conclude that the datasets are, on the whole, lightly used and could easily be processed.
Data Quality
To assess data quality we selected ten datasets at random, downloaded them and assessed them in terms of their structure and associated metadata. The comments about the sparcity of the metadata noted above aside, we found the data to be of a high quality. The formats were consistent, the data structure was tabular and columns were given meaningful headings. Of the data sets we examined all were in machine readable formats and could easily be process.
Conclusion
Whilst the data.gov.uk website contains a broad, interesting and haphazard collection of data, the data it does contain is reasonably well organised. This presents both an advantage and a disadvantage. It plays to our advantage since the regularity of the data we are examining means that the extraction and importation of the data will be relatively straightforward. All the data conforms, to some degree, to a regular pattern of columnar data with associated table headings. At our disadvantage is that the disparate nature of the data means that that it is often difficult to identify data sources that are of genuine use.
Benefits of connecting data
The benefits of linking data remain somewhat unclear. The following issues will be explored:
Finding Data
A key problem with interacting and connecting open data sources is the principal of finding the data. As described above there are key issues with accessing data on the data.gov.uk website. However, there are additional problems with regard to locating relevant data. Whilst data.gov.uk is the flagship open data source, the majority of the relevant data is found on either data.gov or within the Office of National Statistics.
The process of finding data is complex and a key problem is not locating the hubs to find data but to discover the data in the first place.
Whilst these data hubs provide a means of collating data, they are not as successful with regard to driving people towards information of interest. Whilst users may have a clear notion of the nature of the data they are searching for, the hubs offer few methods by which users are able to locate data in which they are interested. The standard search methods available to end users are unable to capture the complexities of searching for relevant data cannot be accounted for within simplistic search interfaces. Thus there is a mismatch between the users needs and the means in which data can be found within a central hub and cannot be accounted for within simplistic search interfaces.
Data Problems
Considering our tool, it is clear that the issues regarding interlinking data are relatively easy to solve. The data itself is generally reasonably regular and our examination has shown that the majority of the data we have accessed and interacted with has been of a regular format. Thus the problems with accessing and manipulating open data is not questions of manipulations or integration - our studies have demonstrated that the key problems with interacting with open data are not in terms of manipulation but are more focused on both finding data of interest and understanding the implications of the data that has been found.
Principle Hurdles
When we started this project we felt that the issues we would face would be largely technical issues surrounding the access and manipulation of data. What we found in developing the tool and running it past users was that whilst this is a problem, it is by no means the only problem we found when using the tool. We identified three critical hurdles that are limiting the uptake of open data within the domain we examined.
Lack of Adequate Data
We have discussed above about the inadequacy of the data hubs to provide good access to data. A further problem we identified is that when data in the domain of interest and containing information we are interested in it does not necessarily follow that the data will be of use. The granularity of the data is a key problem as the level of detail given for many data sets is that the local authority level, yet to make inferences about student origins, data of a much higher granularity is necessary. Thus there is a mismatch between both our needs, and our requirements and the availability of data. Furthermore, we found that whilst data should be relatively independent, this does not necessarily mean that the data does not have an agenda.
The production of open data does not generally happen completely independently. Typically the data is produced, or collected, with a specific purpose in mind and then made open once the data has been collected. Thus there is an implicit agenda within the data regardless of its origin and so it does not necessarily follow that if the data is relevant to our needs that it will meet those needs. Since we are not data producers we are put in a position where we are trying to make the best use of the data that we have to hand.
Limitations of our tool
When developing our tool our intention was to focus on developing a generic tool for aligning geographic data with our student origin data. To some extent our tool is generic in that it allows us to import any data source and align it with student origins. However, the nature of our tool is that, whilst it is generic, it is limited to displaying geographic data and the corresponding histogram information. We found that whilst this meets the purposes of our brief it does not necessarily unlock open data sources for our end users.
This leads us to the general conclusion that it is not possible for one generic tool to meet the requirements of all users. Whilst our tool allows our users to build up a basic understanding of the connections between the given data source and the student data it does not and cannot go beyond that. The requirements of our user group were far more expansive that we initially envisaged and could not necessarily be met with the tools that we developed.
Thus we feel that the notion that open data is best leveraged through the operation of generic tools somewhat lacking - it is clear, through, this project that the requirements and manipulations necessary to make best use of open data are so varied that generic tools can only meet some of these requirements. In addition, we do not feel that these needs could be met through the interaction and actions of a number of generic tools. Our project seemed to indicate that there was almost a need to have an open data specialist to make the best use of the data that was available.
This specialist would have a bank of higher-level generic visualization available to them. They would then programmatically combine the data and these visualisations in order to develop a deeper and more relevant understanding of the data and context in which the data is placed.
Interpretation
The third factor we identified was that, whilst the tool and open data in general, can be combined to increase understanding it does not solve the subsequent problems that users may run into when trying to develop understanding from this data. Thus it is not always the case that even when the right data can be found, and our tool is not lacking in presenting the data that the interpretation and understanding that can be gained from the process is not clear cut. Thus there is a user problem of determining what the data means and what actions to take on the basis of the data.
To some extent this goes beyond the scope of the project but there is a problem of information overload with regard to open data. Thus open data sources drastically increases the amount of information available to end users for making inferences about their domain and it is not necessarily the case that this increased amount of information leads directly to increases insight - indeed the dramatic increase in the amount of information available to end users can lead to more confusion.
Feedback
Feedback from our usergroup informed the hurdles outlined above but the specific feedback collected is also relevant to discuss. The application itself was well received:
“Simple and intuitive to use.”
“Quick to run updates on the map.”
And other feedback indicated that the process of locating relevant datasets is often more difficult than performing an analysis of that data set, so in response to the question “What are the principal hurdles to making more use of open data?”
“Actually finding the datasets which were relevant to the latest challenge set by our directors.”
There were also comments about the geographical limitations of the datasets available.
“International student recruitment is a massive issue for us.”
Summary
Our tool has demonstrated some of the promise of using open data within the higher education domain. We believe that our application represents a valuable first step towards increased usage of open data, however, the tool has generated as many questions as it has answered. Principally, our tool has demonstrated that open data is of use to the higher education sector, however our tool and this use is still in the infancy stages. We believe that the tool represents a valid means of presenting the possibilities of open data to end users but we do not feel that it represents the complete solution. We do not believe that the eventual solution can be found, as open source advocates would lead us to believe, in single generic tools for manipulating data but in the actions of open data experts, who are able to manipulate and derive understanding from open data, in a much closer relationship than generic tools allow.
We therefore see the clear benefits of open data, but do not feel that the current approach with regard to tools, is sufficient enough to derive maximum value from the data sources.
Looking ahead
Sustainability
In principle our project is highly sustainable, although the work will be subject to the usual caveats surrounding the use of software. In order to ensure that our work remains in place outside of the duration of the project we have undertaken some key steps. Firstly we have created a virtual server onto which we will place a working version of the application. This version of the application will be updated over the remainder of the project time in order to ensure that any critical bugs or missing features can be addressed. In addition we will create a lightweight forum alongside the main site functionality in order to ensure that any of our users can request features or report bugs.
Over the remainder of the project, we will check over these feature requests and bug reports and deal with them as we see fit - prioritizing bug fixing over adding new features due to the necessary time constraints. As the project reaches it’s conclusion we will maintain this server for as long as we can, with a minimum duration of a year. This will mean that users will still be able to access the application beyond the lifetime of the project. Furthermore the amount of development required to turn the server application into a stand alone application is non-trivial but not significant and so, if more funding can be found and the need is identified, the application can be converted into a stand alone application.
Future Plans
Our future plans are highly dependent on how the application is used in practice. Whilst our application is currently designed with a view to comparing and contrasting student information there is no reason why we can move beyond this limitation in the future. Our application and methodology could become a simple means of mashing up data sources in a rapid and user friendly fashion. This could have impact within the University environment and beyond in the future.
Summary and reflection
This project has explored how open data sources can be leveraged to enrich and inform local data sources. The project was successful in that it developed a number of tools and techniques for demonstrating that open data, from any source, can be successfully combined with local student information. Our tool allows users to import any geographically oriented dataset and rapidly see how the data correlates with student recruitment data. The main learning outcomes of the project was twofold.
Firstly, it is clear from feedback from our group and our analysis of open data sources that it is the process of identification of relevant data sets that is currently most time consuming for users. Secondly, whilst generic tools are able to provide some of the picture, more flexible manipulation is required to derive a deeper understanding.
A solution to the former is complex - the problems with data.gov.uk indicate that having ‘hubs’ of data is not suficient to fully exploit the advantages that open data brings. It is unclear how to finesse this problem, though one solution might be increased methods of organising and categorizing data (perhaps by how the data has been used, rather than how it could be used). The second issue is that generic tools seem to only be able to offer surface level analyses of information - to get a deeper level of understanding requires much more precise manipulation of data. To address this problem it is likely that an organisation will need a competent programmer, who has experience in manipulating and presenting open data analyses.
Project Downloads
This project has developed three pieces of downloadable content.
Report on data.gov.uk. This is a brief report about the content on data.gov.uk
Importer Tool. This is the tool we developed to import geographical data from any open data source.
Video. This is the video that briefly summarizes the project.
Refection
This project had ambitious aims - namely to develop an open data tool and methodology within a particularly short space of time, and to assess the efficacy of the tool with real end users. The infrastructure of the project ensured that these aims were met - though the tool we developed represents the beginning of further work with open data sets within the higher education environment. I think we began this project with the mindset that the open data problem was a technological one and have ended the project with the mindset that the real problem is informational. It is clear that good programmers and data analysts are able to rapidly generate tools and visualizations of open and local data sources. It is less clear how best to identify relevant data sets. Our project has, however, demonstrated that if these data sets can be found then it is possible to derive valuable insights from the tools and applications that can be built on top of the data.
Appendix
Manual